Sales Analysis for Restaurants
As a restaurant owner or manager, it is crucial for your company’s success to have a thorough understanding of your sales performance.
When conducting a sales analysis for your restaurant, you will need to evaluate several different aspects of your restaurant’s financial performance, including revenue, expenses, profitability, and sales trends.
By conducting regular sales analysis, you can improve your business, increase customer satisfaction, and ultimately drive sales.

Your level of skill in data analysis, the data you have available to you, and the goals you want to achieve with your research all play a role in determining the precise methods and tools you utilise.
You will, however, be able to get useful insights into the operation of your restaurant and make decisions to improve your business that are driven by data if you follow this procedure.
This article will discuss the most important metrics in restaurant sales analysis and how they can be used to measure performance.
Key Metrics in Restaurant Sales Analysis:
Average Check Size: One of the most important things to look at when analysing restaurant sales is how much money was spent on average per check.
It tells you how your menu prices are set up and helps you decide if you need to change anything.
If you find that your average check size is lower than the market average, this could mean that you need to change how you price your menu items or think about adding value-added items to your menu to make the average check size bigger.
Foot Traffic: In restaurant sales analysis, the number of customers who come to your restaurant is another important metric.
This data can help you figure out who your customers are, how popular your restaurant is, and how well your marketing is working.
Statistics from The British Hospitality Association show that, on average, 75 people visit a restaurant in the UK every day.
If you find that your foot traffic is lower than average, it may mean that you need to do more marketing or look at how easy it is to get to your restaurant.
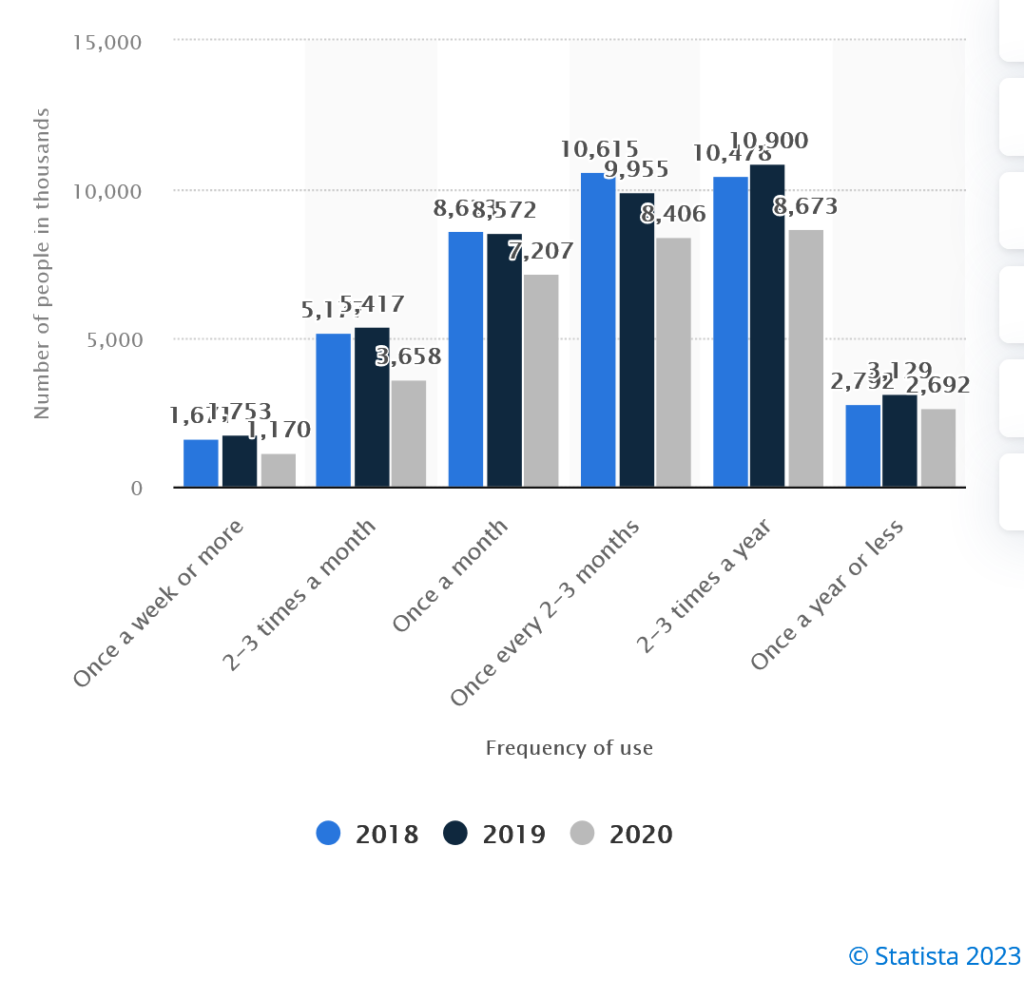
Sales Mix: The percentage of sales that each menu item brings in tells you a lot about what sells well and what doesn’t.
With this information, you can make smart choices about menu changes and sales.
The British Restaurant Association has found that roasted chicken and fish and chips are the most popular menu items in the UK, with an average sales mix of 25% and 20%, respectively.
If you find that some menu items don’t sell as well as others, you may need to change their price, how you promote them, or where they are on the menu.
Labour Costs: Restaurants spend a lot of money on salaries and benefits. Monitoring labour expenditures is essential for staying profitable and staying within financial constraints.
The Restaurant Group reports that in the United Kingdom, labour accounts for roughly 35% of total revenue on average. In restaurants like Pizza Hut, the cost of labour could be anything between 22.5% to 25% of Sales.
If your labour costs are significantly higher than the industry standard, it may be time to re-evaluate your staffing levels or look into ways to boost productivity.
Food and Beverage Costs: The price of food and drinks is another important cost for restaurants. Keeping track of how much food and drinks cost can help you keep your costs down and make more money.
The British Beer and Pub Association has found that restaurants in the UK spend an average of 45% of their total income on food and drinks. This figure is very high and in an ideal world, you want to target a Cost of Sales of between 30% to 33%. If you are going to achieve your Prime Cost of 65% or below.
If your food and drink costs are higher than average, you may need to look at your suppliers, menu items, or portion sizes to find ways to cut costs.
Customer Satisfaction: How well your restaurant does depends on what customers say about the food, the service, and the atmosphere.
When customers are happy, they come back and tell their friends about the business.
Recent polls by The Institute of Customer Service show that the average customer satisfaction score in the UK is 7.7 out of 10. The UK Customer Satisfaction Index (UKCSI) for January 2023 is 77.7 (out of 100), which is a 0.7-point fall between July 2022 and January 2022.
If your customer satisfaction score is lower than average, you may need to look at your service and food quality, as well as the atmosphere and customer experience at your restaurant.
Sales Trends: Changes in sales over time can tell you a lot about how well your restaurant is doing.
Tracking sales trends can help you find places to improve and help you make smart choices about promotions and changes to your menu.
According to industry data, the average annual growth in restaurant sales in the United Kingdom is 3%.
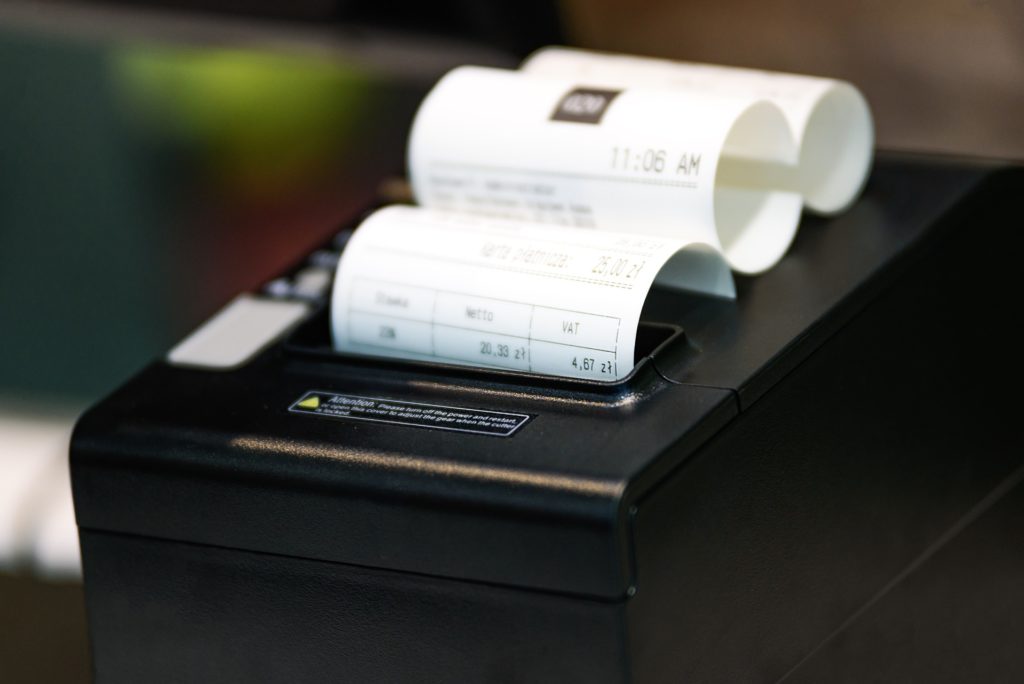
Sales Analysis
Analysing Restaurant Sales Data:
To carry out an in-depth analysis, it is essential to collect precise data regarding sales.
Using a point-of-sale system, logging cash and credit card transactions, and performing regular audits are some of the steps you can take to guarantee that the data you gather is accurate.
There are many other steps you can take to ensure that your data collection is accurate.
After you have gathered all of your data, you should analyse it using a variety of methods, such as trend analysis, regression analysis, and correlation analysis. Once you have done this, you will have what you need to conclude your research.
Gather data: You would need to collect data from a wide variety of sources and employ a wide variety of analytical tools and methods to make sense of the information you gathered to perform restaurant sales data analysis.
The following is an exhaustive illustration of one possible method for analysing the sales data from a restaurant:
First gather information from several sources, including your point-of-sale system, financial records, consumer feedback, market research, and so forth.
Clean and organise the data: Streamline and arrange the data while ensuring that it is correct, comprehensive, and consistent throughout.
Get rid of any duplication, extreme values, or values that are missing.
Create a structure for the information that will make it simple to examine in the future.
Define your metrics: Determine the essential indicators that are most relevant to your restaurant, such as the average check size, foot traffic, sales mix, labour costs, food and beverage prices, and customer satisfaction ratings.
Analyse the data: To gain a better understanding of the data, you can make use of many different analytical tools and methods, such as trend analysis, comparison analysis, and regression analysis.
To measure the impact of a promotion or special event, for instance, you may analyse the relationship between the average check size and foot traffic in the establishment.
Interpret the results: Conduct an evaluation of the findings of your analysis and provide an interpretation of the insights you have received.
Find the patterns, relationships, and trends that can assist you in making informed decisions regarding your business.
Take action: Create a plan of action to improve your restaurant and boost sales using the insights you’ve gathered from your investigation of the situation.
To bring in more customers, you may, for instance, alter the prices of the items on your menu, work to enhance the level of service you provide, or make investments in marketing.
Monitor and evaluate: Make it a habit to check in on your metrics regularly and assess how your activities are having an effect. A good benchmark may be daily, weekly, or monthly.
Maintain a consistent practice of re-evaluating your findings and modifying them as warranted.
Restaurant Data Analytics to Grow Your Business
Using restaurant sales analysis to make decisions based on facts: By looking at your restaurant’s sales data, you can find ways to improve and make decisions that will help you make the most money and spend the least.
Some examples of decisions that are based on data are changes to the menu to make the business more profitable, changes to operational processes to cut costs, and promotions to bring in more customers.
With restaurant sales analysis, you can use data, analytical tools, and business sense to make decisions that are based on facts.
Here’s a full example of how you could use restaurant sales analysis to make decisions based on facts:
Identify the decision to be made: Find a specific decision you need to make, like how to improve your menu, how many people to hire, how to market your business, or what products to sell.
Gather relevant data: Get the information you need for the decision you need to make. This could include information about sales, feedback from customers, market research, and other useful data.
Clean the data and put it in order: Make sure the information is correct, full, and consistent. Get rid of any duplicates, outliers, or values that are missing. Set up the information so that it is easy to analyse.
Set up key measurements: Find the key metrics that are important to your decision, such as average check size, foot traffic, sales mix, labour costs, food and drink costs, and customer satisfaction.
Analyse the data: Use trend analysis, comparison analysis, and regression analysis, among other tools and methods, to make sense of the data.
For example, you could look at how menu prices affect customer satisfaction to figure out what the best menu prices are for your restaurant.
Interpret the results: Evaluate the results of your analysis and explain what you’ve learned from them. Find patterns, connections, and trends that can help you decide what to do.
Evaluate potential outcomes: Based on what you learned from your analysis, think about how different decisions might turn out. Use scenario planning and other tools to figure out how different business decisions will affect your company.
Make the decision: Make the best decision for your business based on what you’ve learned from your analysis and how you’ve thought about the possible outcomes.
Monitor and evaluate: Keep an eye on the results of your decision and think about how it has changed things.
Make changes as needed and keep collecting and analysing data to help you make decisions in the future.
By following this process, you can make decisions based on the latest data and insights that are tailored to the needs of your restaurant. By keeping an eye on and evaluating your decisions regularly, you can make sure that your restaurant stays competitive and keeps growing.
Related articles:
Restaurant Management Strategies
How To Make A Profit In Your Restaurant
Restaurant Management Structure
Software Tools and Systems for Restaurant Sales Analysis
You can use a variety of software programmes and methods for restaurant sales analysis, such as:
Point-of-sale (POS) systems:
Most modern point-of-sale (POS) systems provide sales data that can be utilised for sales analysis. This data can include item sales, category sales, hourly sales, and more.
Business intelligence (BI) tools:
The interactive dashboards and reports provided by BI technologies such as Tableau, PowerBI, and QlikView can be used to visualise sales data and make data-driven choices.
Accounting and financial management systems:
Accounting and financial management systems, such as QuickBooks or Xero, give comprehensive financial data that can be analysed to determine sales and profitability.
Customer relationship management (CRM) systems:
CRM systems, like Salesforce or Zoho CRM, give customer data that may be analysed to provide insight into sales and customer behaviour.
Data analysis tools:
Tools for data analysis, such as R or Python, can be used to do complex data analysis and to construct sales analysis models and algorithms.
Each tool or system has its advantages and disadvantages, and the most effective one for you will rely on your particular needs and objectives.
Consider the size and complexity of your restaurant, the amount and type of data you need to analyse, and your available resources when selecting the appropriate tool or system for sales analysis at your restaurant.

Frequently Asked Questions
How do do sales projections for a restaurant?
The first step in making accurate restaurant sales forecasts is to compile historical data on sales, adjusting for variables like the time of year, the type of food being served, and any one-off events.
Analyse this data to detect sales trends and patterns, and examine any future events that may have an impact on sales.
Use this data to produce a future sales projection using a spreadsheet, business intelligence tool, or financial management system. Continuously compare your actual sales to your predictions and make any necessary adjustments.
What is a Restaurant Market Analysis?
A restaurant market analysis is an in-depth examination of the restaurant business in a particular location, including information on consumer demographics, the level of competition, and the general state of the economy.
It is used to assist restaurant owners in gaining a better understanding of the industry and making educated decisions regarding their pricing, menu offerings, and marketing initiatives.
What Tools Are Used To Monitor Restaurant Sales?
Point-of-sale (POS) systems, accounting software, and business intelligence tools are just a few of the tools that can be used to track restaurant sales.
Restaurant managers and owners can use these technologies to measure sales in real-time, keep an eye on trends, and spot potential improvement areas.
What are the five most important factors in choosing a restaurant?
Menu: When selecting a restaurant, the crucial consideration customers consider is the menu options, the quality of the ingredients, and the cooking techniques.
Price: When selecting a restaurant, customers look at both the individual prices of things on the menu as well as the restaurant’s overall value for the money.
Service: The speed and friendliness of the staff, as well as the quality of service, can have a big effect on the dining experience.
Atmosphere: The entire quality of the dining experience can be significantly influenced by elements such as the ambience and atmosphere of the restaurant, as well as the décor, the music, and the lighting.
Location: The decision to eat at a certain restaurant can depend in part on how convenient and accessible it is, including how close it is to parking and public transportation.
What is the average meal for two in the UK?
The National Restaurant Association recently did a survey and found that the average restaurant bill in the UK is £22.50.
In the United Kingdom, you can choose a meal from many different types of cuisine.
Here are a few examples per head:
- Asian Restaurant £25
- Chinese Restaurant £20
- French Restaurant £33
- Italian Restaurant £26
- Japanese Restaurant £29
- Mexican Restaurant £24
In a lot of a la carte restaurants, depending on how many courses you order, it will cost between £35 and £50. Two courses are around £35, and three courses will cost around £50, without drinks.
Conclusion:
Conducting restaurant sales analysis on a consistent basis is essential to the success of your restaurant.
You can improve the efficiency of your restaurant and bring in more money by conducting an in-depth analysis of important data, such as the average check size, the number of customers who walk through your doors, the sales mix, the labour costs, the prices of food and beverages, and the overall satisfaction of your customers.
These indicators offer important insights into the financial success of your restaurant as well as its client base, enabling you to identify areas of strength as well as the potential for improvement.
You will be able to make outstanding judgments that are data-driven and will help your restaurant prosper in the highly competitive restaurant market and flourish for many years if you perform periodic sales analysis.
Sources:
The National Restaurant Association: https://www.restaurant.org/
The British Hospitality Association: https://www.bha.org.uk/
The British Restaurant Association: https://www.britishrestaurantassociation.org/
The Restaurant Group: https://www.restaurantgroup.com/
The British Beer and Pub Association: https://www.beerandpub.com/
The Institute of Customer Service: https://www.instituteofcustomerservice.com/
Note: The statistics mentioned in this article are based on recent research and industry data, and may not reflect the current market conditions. The article is intended to be informative and neutral and not to promote any specific brand or organization.

